3 Economic Indicators Proving the Market May be Ahead of Itself
This week the S&P 500 hit a new all-time high. Unfortunately, a large amount of U.S. economic data doesn’t have quite as much to cheer about. Small Business Optimism, New Home Builds and the Conference Board’s leading economic indicators all show little to no rebound since the market’s prior high in September of 2018. A growing divergence between these indicators and stock prices could lead to a sentiment driven bubble.
Current Economic Indicators Speaking for the Market
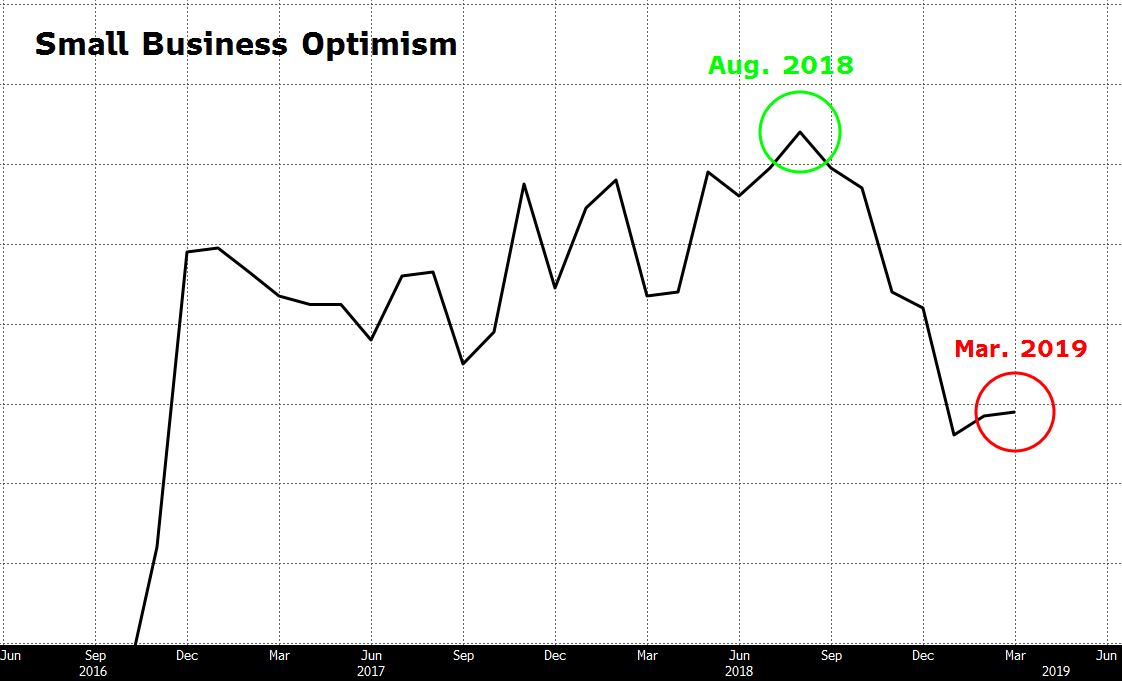
Small Business Optimism
The NFIB’s Small Business Optimism index helps to gauge domestic plans for employment, inventories, expansion and more. The index stood at a multi-year high of 108.8 at the end of August 2018. We have yet to see any significant uptrend that would suggest a move towards the prior highs. Currently the index reads 101.8
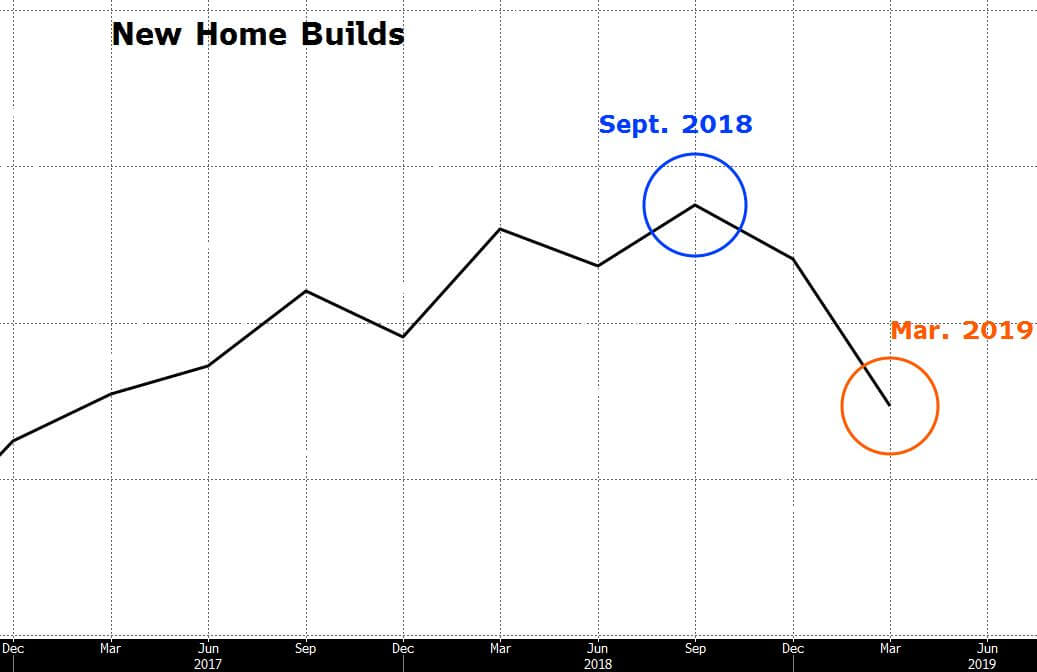
New Home Builds
Following trends in the construction of new housing helps to foresee future demand in the housing market as well as certain input goods such as: copper, lumber and other industrious materials. New single unit housing construction has seen no letup in its decline since September 2018. The index is down nearly 15% since its high last year and is currently at the lowest level in over a year. In order to strip out the volatility of this index’s readings, the data below represents a 4-month moving average.
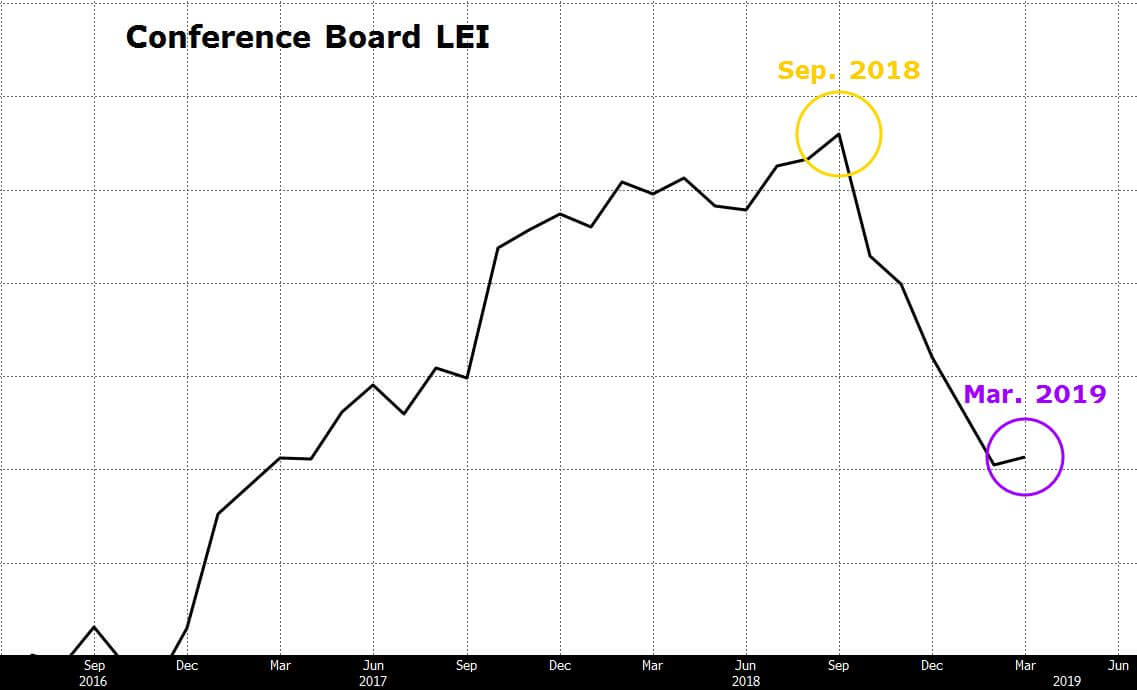
Conference Board LEI
The Conference Board’s leading economic indicator aggregates 10 different indicators to give the public a future perspective of the United States’ economy. The Conference Board’s leading economic indicator is one of the most widely watched indices among financial processionals due to its accuracy and broadness in scope. While we have seen some consolidation with a minor rebound in these leading economic indicators, we are a far shot from our September highs.
The Argument: Government & Corporations Unite!
A clear disconnect between expectation and reality exists. Major U.S. equity indices have tested price levels near an all-time high. At the same time, a variety of economic indicators show weakness. However, government and corporations are currently using their influence in the markets on a level that has not been seen before.
Corporate buybacks have been a key player in why stocks bottomed in December 2018. According to J.P Morgan’s chief U.S. equity strategist, Dubravko Lakos-Bujas: “some $800 billion in buybacks are scheduled for 2019”. Given Trump’s one-time allowance of corporate cash repatriation, large corporations continue to look for ways to increase their earnings per share. Stock buybacks don’t seem to be going anywhere just yet and may provide somewhat of a safety net for lower U.S. stock prices.
On top of this, the federal reserve has done more than their fair job in safeguarding against a U.S. recession. Some would say they’ve done too much. Federal Reserve chairman, Jerome Powell, has pivoted several times on the issue of interest rate changes depending on the direction of U.S. equities. This stands in stark contrast to prior Fed practices that tended to look after the interest of the economy, not of Wall Street’s. Clearly the Fed’s accommodation to stock prices mixed with their eagerness to appease the hunger of potential economic issues creates yet another pampering barrier to lower equity prices.
Can Economic Indicators Justify the Market’s Moves?
With the Fed’s dovish stance, corporation’s hunger for equity and economic data’s continued decline, we are in for a battle of expectations versus reality. Currently the market is pricing in little to no earnings growth for companies in the S&P 500. All-time highs and a continuation of the bull market rally could breakout if earnings surprise on the upswing. However, remaining at status quo won’t cut it. A lack of improvement in U.S. economic data is likely to have the markets heading back into the prior year’s slump. Want to know when it’s time to move away from stocks? Take a look at our Stock-Bond Rotation Model.